In the fast-paced world of technology, staying updated with the latest advancements is essential to maintaining a competitive edge. Google Cloud Monitoring continues to revolutionize the way businesses monitor and optimize their applications and infrastructure. In this article, we will delve into the exciting new features and enhancements introduced in Q2 2023, empowering you to unlock the full potential of Google Cloud Monitoring and drive your organization towards operational excellence.
Improved Alerting Capabilities
Google Cloud Monitoring has bolstered its alerting capabilities, providing you with more flexibility and precision in monitoring critical aspects of your infrastructure. The enhanced alerting system enables you to set up advanced conditions based on custom metrics, aggregate metrics, and percentiles. With greater control over thresholds and notification channels, you can proactively detect and address any anomalies, minimizing downtime and optimizing performance.
Advanced Dashboarding and Visualization

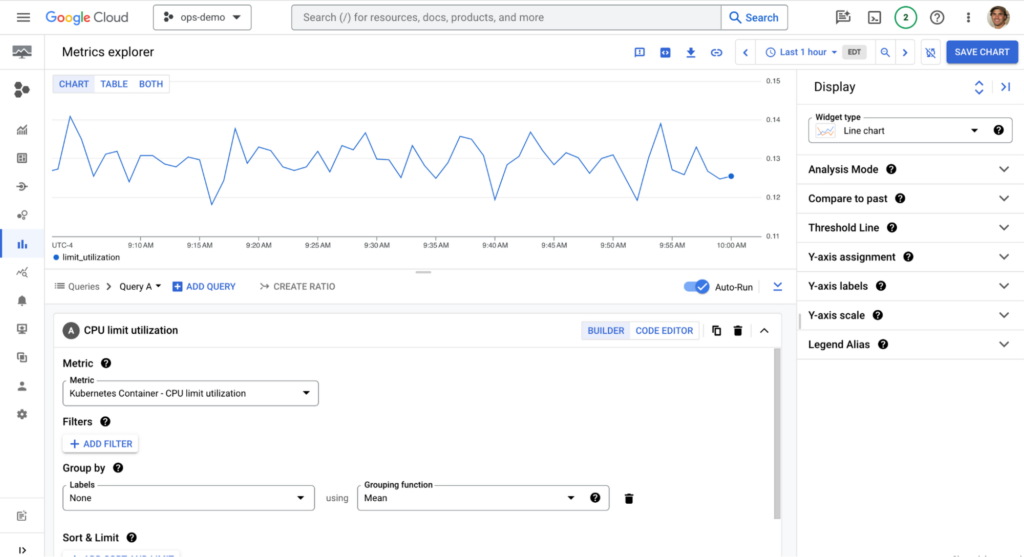
Q2 2023 brings an array of advanced dashboarding and visualization features to Google Cloud Monitoring. The new customizable dashboards allow you to create tailored views of your infrastructure, applications, and services, providing real-time insights into their performance and health. Leveraging a diverse set of visualization options, such as line charts, heat maps, and histograms, you can analyze complex data patterns and make informed decisions to optimize resource allocation and improve efficiency.
Dashboards you may share

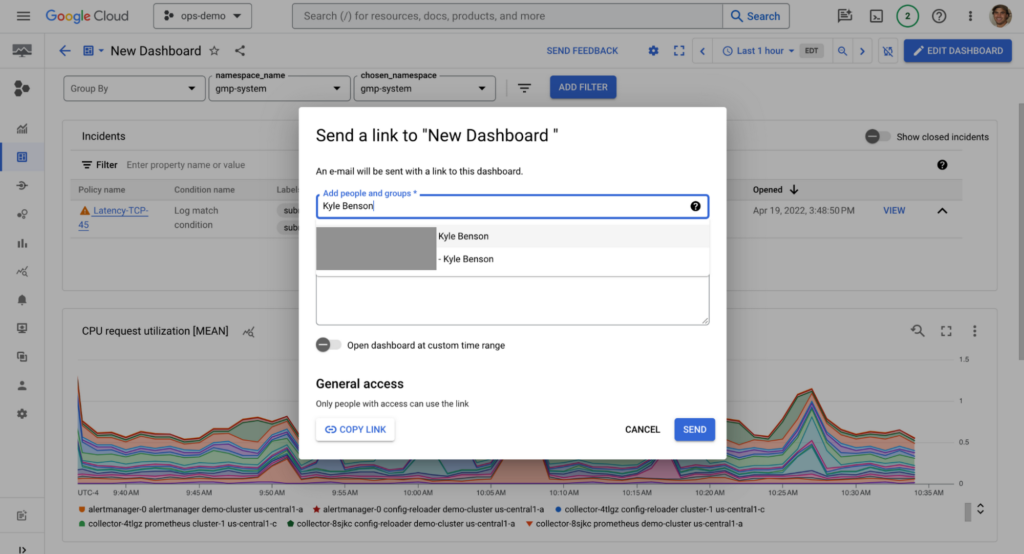
Shareable dashboards make it simple to work together on common problems, and you can change IAM permissions to provide team members the access they require to provide immediate assistance. Simply click the Share icon in the upper right corner of the dashboard and input the email addresses of the recipients to create a shared dashboard. The dashboard will then be accessible to them through their own Monitoring account.
New widget for incidents

The new incident widget for dashboards gives you rapid access to information about current events as well as visual representations of other crucial data and logs. Click the Incidents tab in the Monitoring console to display the incident widget. You will see a list of all current issues, together with information on their severity, status, and impacted resources, in the widget. To get further information about an event, including the cause and impacted users, simply click on it.
Integrating the GKE uptime check
By enabling you to establish uptime checks directly from the Google Kubernetes Engine UI, we have increased the breadth of our support for GKE service uptime Checks. When using the GKE UI to test out a service, you can instantly establish an uptime check from that UI without having to move from where you are. Users may rapidly begin monitoring their GKE services using Uptime Checks since it is one of the simplest methods to start monitoring your services without any additional equipment.

We’ve also included a brand-new dedicated uptime check for Cloud Run, which makes it simpler to define objectives against Cloud Run services and improves tracking of the service’s health as seen by end users or clients.
Upgrades to Alerting
A large portion of the troubleshooting cycle is driven by alert rules. We now provide suggestions to streamline onboarding in order to increase the signal-to-noise ratio for users of Google Cloud who are less experienced.
To assist you in getting started with monitoring the best Google Cloud services, we have published suggested alert policies. Networking services, Compute Engine, and GKE are all included in this. The templates may be retrieved programmatically from GitHub and are available in Cloud Console.
Alerts may now be snoozed to help your team hear each other more clearly. This is helpful when an outage is known to be escalating or during planned repair times. Currently, this experience is accessible through the Terraform-compatible GCloud, API, and UI. The API may be used to schedule repeated snoozes, and built-in recurrence functionality will eventually be available.
Google Cloud Monitoring continues to evolve and introduce powerful features that empower businesses to monitor, optimize, and secure their applications and infrastructure. The Q2 2023 updates enhance alerting capabilities, dashboarding and visualization, integration with Google Cloud services, anomaly detection, and security and compliance measures. By harnessing the full potential of Google Cloud Monitoring, you can proactively manage your environment, identify performance bottlenecks, and drive operational excellence. Stay ahead of the competition by leveraging the latest advancements in Google Cloud Monitoring and unlock the true potential of your organization.

[…] Power of Google Cloud Monitoring: What’s New in Q2 2023 Simplify Data Analytics with BigQuery Dataset for Cloud Optimization Google Cloud Firewall Features […]
[…] the realm of troubleshooting, Google Cloud is constantly striving to discover innovative ways to simplify the process for our valuable […]
[…] the highest German security requirements for our services thanks to the availability of the new Google Cloud region in Berlin-Brandenburg together with the current area in Frankfurt thanks to Google Cloud […]
[…] and client expectations. AI-enabled insurance underwriting platform Quantiphi is launched on Google Cloud using Unqork and Dociphi, its IDP Platform. This helps commercial insurers automate difficult […]
[…] Cloud Monitoring‘s Synthetic Monitoring is Now Widely Available […]