Reduce GPU usage with more intelligent autoscaling for your GKE inferencing tasks.
The amount of time the GPU is active, or its duty cycle, is represented by GPU utilization.
Running LLM inference workloads can be expensive, even though LLM models provide enormous benefit for a growing number of use cases. Autoscaling can assist you in cost optimization if you’re utilizing the most recent open models and infrastructure. This will guarantee that you’re fulfilling consumer demand while just spending for the AI accelerators that you require.
Your LLM inference workloads may be easily deployed, managed, and scaled with Google Kubernetes Engine (GKE), a managed container orchestration service. Horizontal Pod Autoscaler (HPA) is a quick and easy solution to make sure your model servers scale with load when you set up your inference workloads on GKE. You can attain your intended inference server performance goals by adjusting the HPA parameters to match your provisioned hardware expenses to your incoming traffic demands.
In order to give best practices, it has evaluated several metrics for autoscaling on GPUs using ai-on-gke/benchmarks, since configuring autoscaling for LLM inference workloads can also be difficult. HPA and the Text-Generation-Inference (TGI) model server are used in this configuration. Keep in mind that these tests can be applied to other inference servers, such vLLM, that use comparable metrics.
Selecting the appropriate metric
Here are a few sample trials from metrics comparison that are displayed using dashboards from Cloud Monitoring. For each experiment, Google used a single L4 GPU g2-standard-16 computer to run TGI with Llama 2 7b using the HPA custom metrics stackdriver adaptor. It then generated traffic with different request sizes using the ai-on-gke locust-load-generation tool. For every trial shown below, it employed the same traffic load. The following thresholds were determined by experimentation.
Keep in mind that the mean-time-per-token graph represents TGI’s metric for the total amount of time spent on prefilling and decoding, divided by the number of output tokens produced for each request. It can examine the effects of autoscaling with various metrics on latency with this metric.
GPU utilization
CPU or memory use are the autoscaling metrics by default. This is effective for CPU-based workloads. However, as inference servers rely heavily on GPUs, these metrics are no longer a reliable way to measure job resource consumption alone. GPU utilization is a measure that is comparable to GPUs. The GPU duty cycle, or the duration of the GPU’s activity, is represented by GPU utilization.
What is GPU utilization?
The percentage of a graphics processing unit’s (GPU) processing power that is being used at any given moment is known as GPU usage. GPUs are specialized hardware parts that manage intricate mathematical computations for parallel computing and graphic rendering.
With a target value threshold of 85%, the graphs below demonstrate HPA autoscaling on GPU utilization.
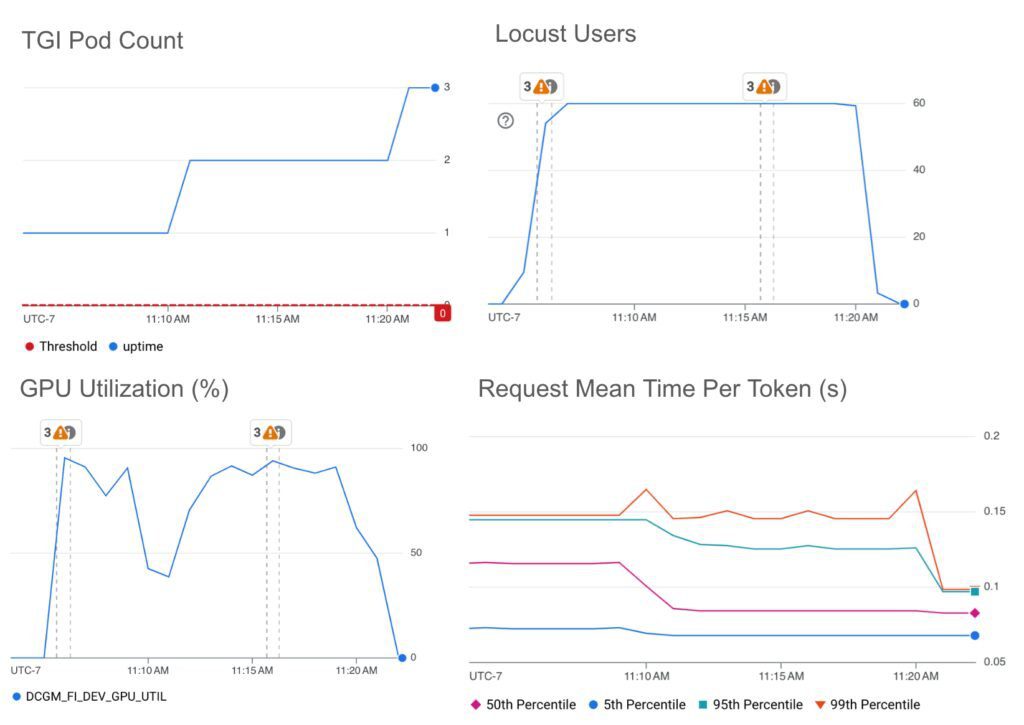
The request mean-time-per-token graph and the GPU utilization graph are not clearly related. HPA keeps scaling up because GPU utilization is rising despite a decline in request mean-time-per-token. GPU utilization is not a useful indicator for LLM autoscaling. This measure is hard to relate to the traffic the inference server is currently dealing with. Since the GPU duty cycle statistic does not gauge flop utilization, it cannot tell us how much work the accelerator is doing or when it is running at maximum efficiency. In comparison to the other measures below, GPU utilization tends to overprovision, which makes it inefficient from a financial standpoint.
In summary, Google does not advise autoscaling inference workloads with GPU utilization.
Batch size
It also looked into TGI’s LLM server metrics because of the limitations of the GPU utilization metric. The most widely used inference servers already offer the LLM server metrics that we looked at.
Batch size (tgi_batch_current_size), which indicates the number of requests handled in each iteration of inferencing, was one of the variables it chose.
With a goal value threshold of 35, the graphs below demonstrate HPA autoscaling on the current batch size.
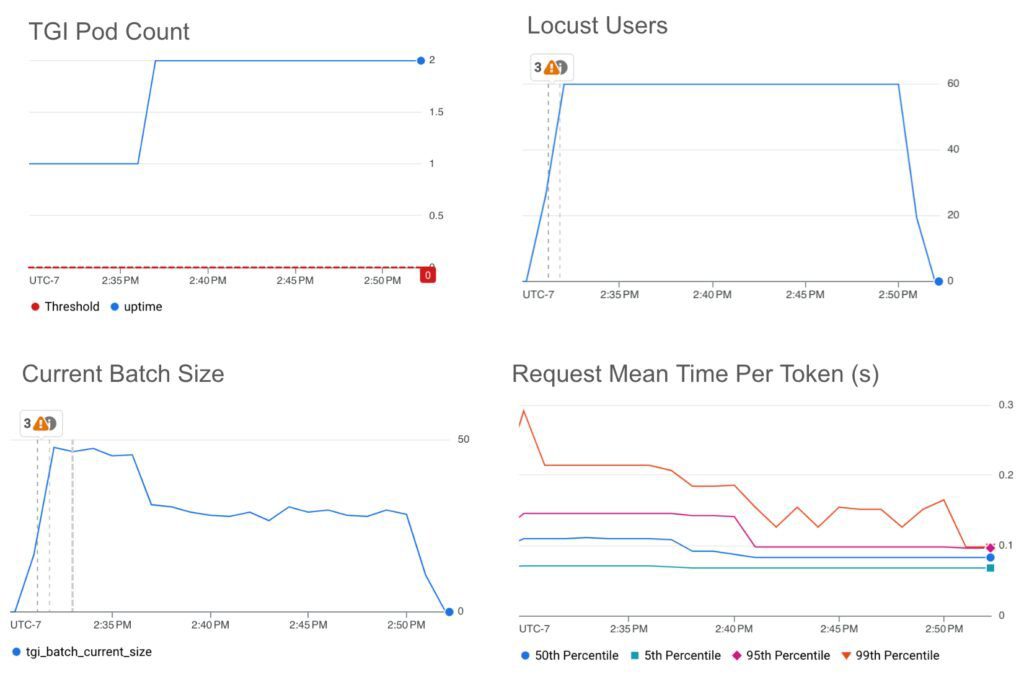
The request mean-time-per-token graph and the current batch size graph are directly related. Latencies are lower with smaller batch sizes. Because it gives a clear picture of the volume of traffic the inference server is currently handling, batch size is an excellent statistic for optimizing for low latency. One drawback of the current batch size metric is that, because batch size can fluctuate slightly with different incoming request sizes, it was difficult to trigger scale up while attempting to attain maximum batch size and, thus, maximum throughput. To make sure HPA would cause a scale-up, it has to select a figure that was somewhat less than the maximum batch size.
If you want to target a particular tail latency, we advise using the current batch size metric.
Queue size
Queue size (tgi_queue_size) was the other TGI LLM server metrics parameter that was used. The amount of requests that must wait in the inference server queue before being added to the current batch is known as the queue size.
HPA scaling on queue size with a goal value threshold of 10 is displayed in the graphs below.
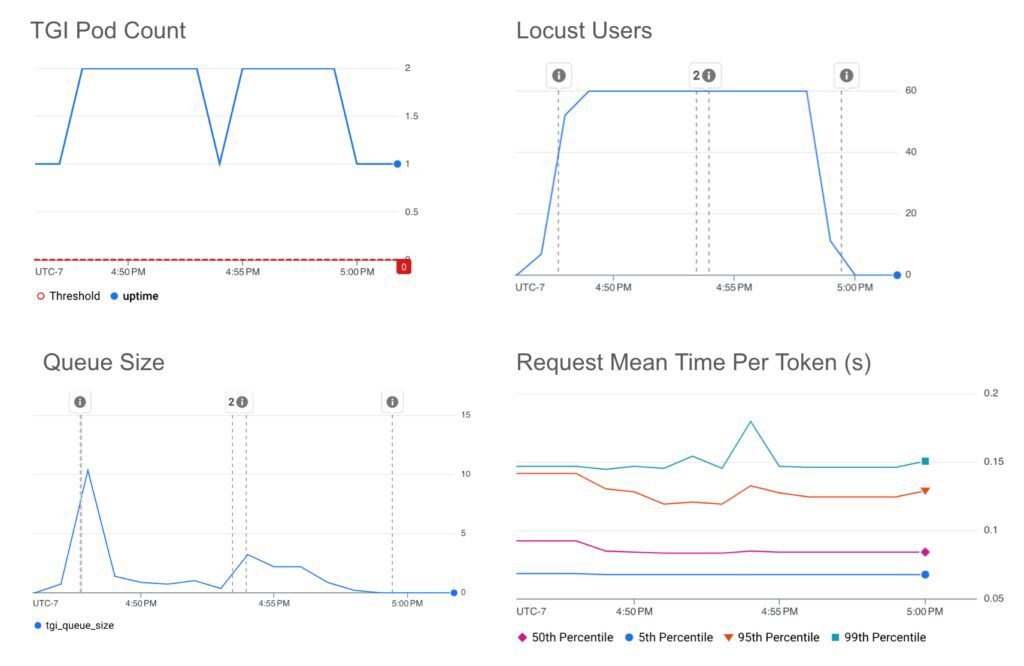
*Note that when the default five-minute stabilization time ended, the HPA initiated a downscale, which is when the pod count dropped. This window for the stabilization period and other basic HPA configuration settings can be easily adjusted to suit your traffic needs.
We see that the request mean-time-per-token graph and the queue size graph are directly related. Latencies increase with larger queue sizes. It discovered that queue size, which gives a clear picture of the volume of traffic the inference server is waiting to process, is an excellent indicator for autoscaling inference workloads. When the queue is getting longer, it means that the batch is full. Autoscaling queue size cannot attain latencies as low as batch size since queue size is solely based on the number of requests in the queue, not the number of requests being handled at any given time.
If you want to control tail delay and increase throughput, it suggests using queue size.
Finding the thresholds for goal values
The profile-generator in ai-on-gke/benchmarks to determine the appropriate criteria for these trials in order to further demonstrate the strength of the queue and batch size metrics. In light of this, it selected thresholds:
- It determined the queue size at the point when only latency was increasing and throughput was no longer expanding in order to depict an optimal throughput workload.
- It decided to autoscale on a batch size at a latency threshold of about 80% of the ideal throughput to simulate a workload that is sensitive to latency.
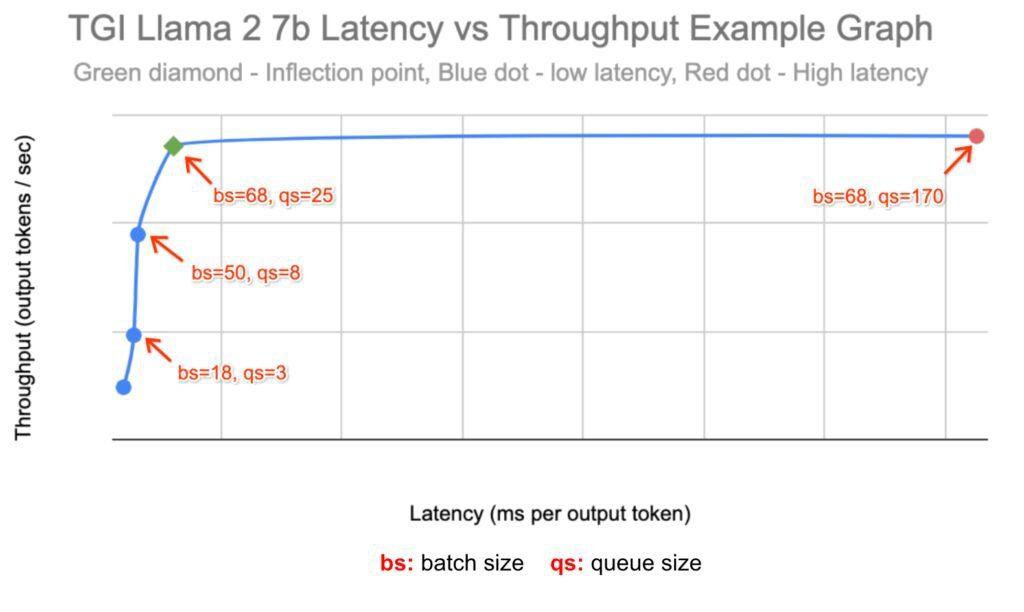
It used a single L4 GPU to run TGI with Llama 2 7b on two g2-standard-96 machines for each experiment, allowing autoscaling between 1 and 16 copies with the HPA custom metrics stackdriver. The locust-load-generation tool from ai-on-gke was utilized to create traffic with different request sizes. After finding a load that stabilized at about ten replicates, we increased the load by 150% to mimic traffic surges.
Queue size
HPA scaling on queue size with a goal value threshold of 25 is displayed in the graphs below.
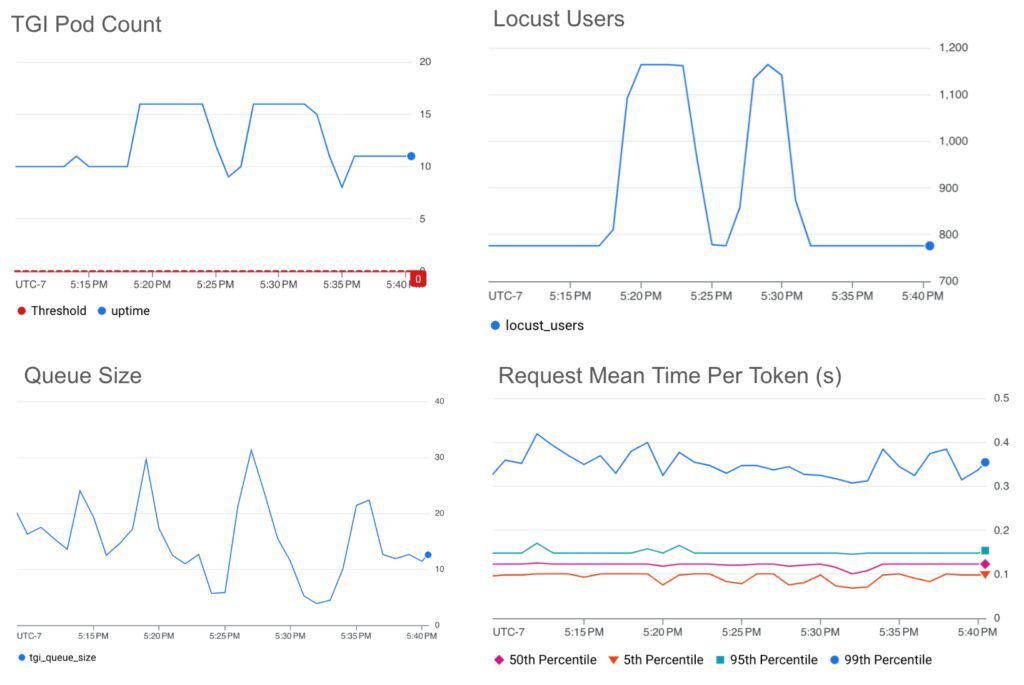
We observe that even with the 150% traffic spikes, its target threshold can keep the mean time per token below ~0.4s.
Batch size
The HPA scaling on batch size with a goal value threshold of 50 is displayed in the graphs below.
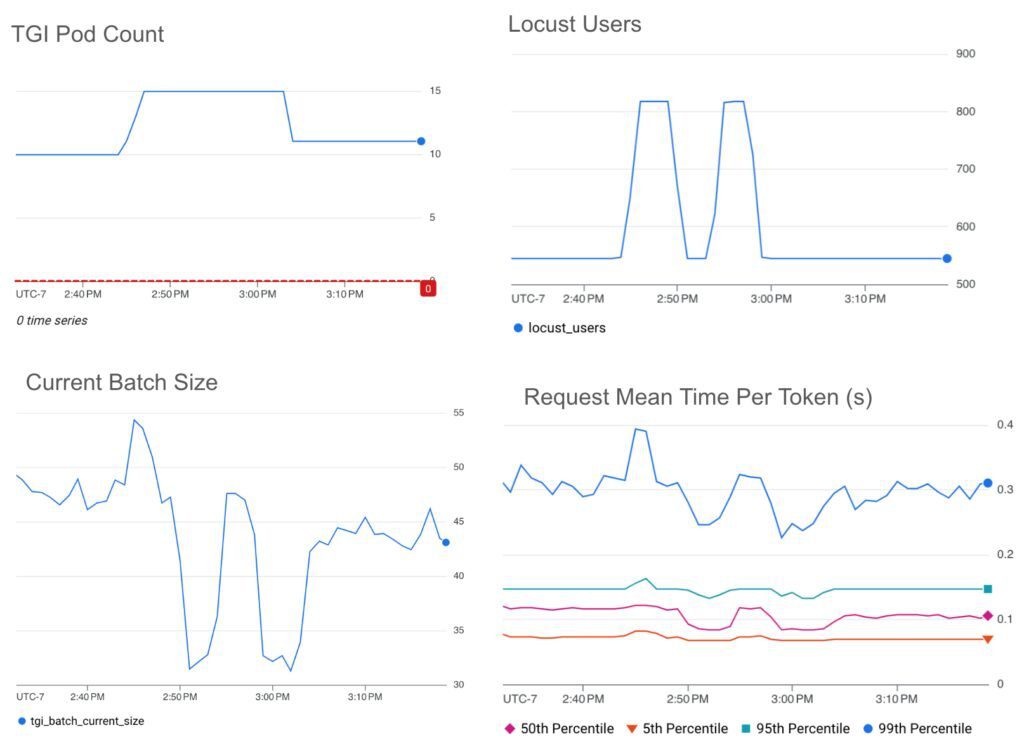
Take note that the roughly 60% decrease in traffic is reflected in the about 60% decrease in average batch size.
We observe that even with the 150% traffic increases, its target threshold can keep the mean latency per token nearly below ~0.3s.
In contrast to the queue size threshold chosen at the maximum throughput, the batch size threshold chosen at about 80% of the maximum throughput preserves less than 80% of the mean time per token.
In pursuit of improved autoscaling
You may overprovision LLM workloads by autoscaling with GPU use, which would increase the cost of achieving your performance objectives.
By autoscaling using LLM server measurements, you may spend as little money on accelerators as possible while still meeting your latency or throughput targets. Targeting a particular tail latency is made possible by batch size. You may maximize throughput by adjusting the queue size.

