Container Insights with enhanced observability for Amazon EKS
AWS released a new feature last year to increase your observability for Amazon Elastic Kubernetes Service (Amazon EKS): increased observability in Amazon CloudWatch Container Insights. By offering comprehensive performance data and logs, this feature speeds up identifying and resolving container problems.
AWS is expanding this feature today by introducing Enhanced observability for your Amazon Elastic Container Service (Amazon ECS) container workloads. By lowering your mean time to detect (MTTD) and mean time to repair (MTTR) for all of your applications, this new feature will help you avoid problems that can impair user experience.
This is a brief overview of Container Insights for Amazon ECS with enhanced observability.
An important gap in container monitoring is filled by Container Insights with enhanced observability. Correlating metrics with logs and events used to be a laborious procedure that frequently required manual searches and application architectural knowledge. With the help of this feature, CloudWatch and Amazon ECS can now automatically gather detailed performance data, including CPU usage at the task and container levels, and offer visual drill-downs that make root-cause analysis simple.
The following use cases are made possible by this new capability:
- Examine detailed resource utilization trends and correlate telemetry data to rapidly pinpoint the underlying issues.
- Use carefully chosen dashboards that are based on AWS best practices to proactively manage your ECS resources.
- With the help of the corresponding infrastructure anomalies, keep track of your most recent deployments and the underlying reasons why they failed. This will help you identify problems and rollbacks more quickly if needed.
- Monitor resources across several accounts with ease and without the need for manual setup. Observability through a single pane of glass lowers operational overhead due to built-in cross-account capability.
- Correlating infrastructure with the services that are operating and identifying the affected services is made easy by integration with other CloudWatch services, such as Application Signals and CloudWatch Logs.
Using enhanced observability and container insights for Amazon ECS
Container Insights can be enabled with enhanced observability in two ways:
Cluster-level onboarding: It can be turned on for individual clusters.
Account-level onboarding: You can also activate it at the account level, which makes all newly formed clusters in your account automatically observable. By removing the need to manually enable it for every new cluster, this method saves time and effort.
Go to the Amazon ECS console and choose Account settings to activate this capability at the account level. You can see that it is currently disabled under the CloudWatch Container Insights observability area. An update is your choice.
You discover Container Insights, a new option with enhanced observability, on this page. After choosing this option, select Save changes.
When you create a new cluster, you have the option to enable this functionality at the cluster level if necessary.
You can make this feature available to your current clusters as well. You select Update cluster and then pick the option to accomplish this.
You can examine task-level metrics in your cluster overview console by going to the Metrics tab after it has been activated. You may choose View Container Insights, which will take you to the Container Insights page, to view health and performance metrics for all of your clusters.
To obtain a comprehensive view of all your workloads across several clusters, you can access Container Insights after navigating to Amazon CloudWatch.

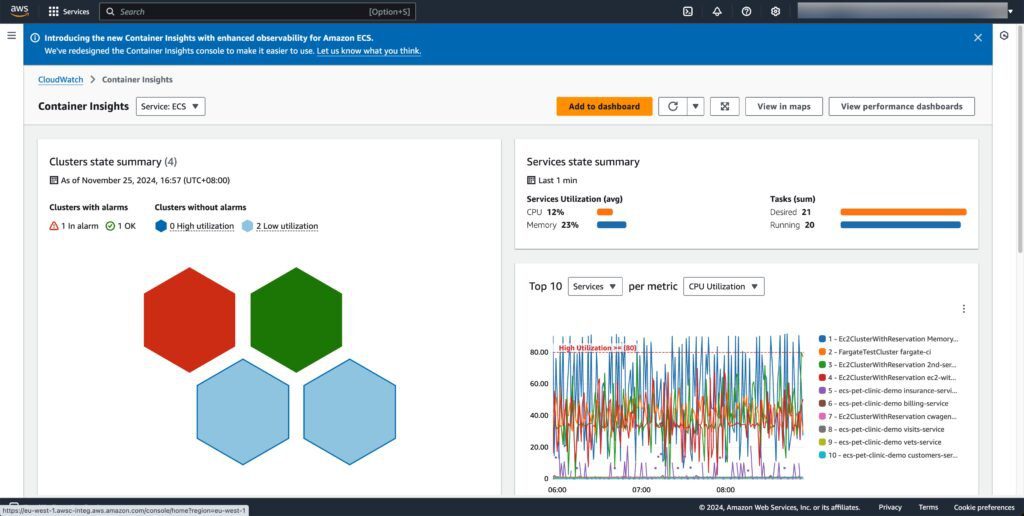
This view provides an easy-to-understand, high-level overview of cluster health using a honeycomb representation, addressing the difficulty of efficiently monitoring clusters, services, tasks, and containers. A dual-state monitoring strategy is used by the dashboard:
- Red or green alarm states reflect thresholds and alerts set by the customer, enabling teams to set up monitoring according to their own needs.
- Utilization status (dark blue or light blue): Tracks resource use trends across containers using CloudWatch’s built-in best practices. Teams are able to proactively identify any resource restrictions before they affect performance since the darker blue shows clusters working under higher usage.
Suppose that one of your clusters has a problem. By hovering over the cluster, you can see every alarm that has been set up beneath it at every tier, from the cluster layer to the container layer.
You may also choose to see every cluster as a list. The list format, which shows account IDs and cluster ownership designations, is crucial for cross-account observability. This makes it easier for DevOps engineers to find possible application problems fast and work with account owners to fix them.
If you want to do more exploring now. You get to the Container Insights comprehensive dashboard view after choosing your cluster connection. You can see that this cluster’s memory usage has increased.
You can rapidly determine which services are creating this problem by delving deeper into container-level facts.
The Filters option, which enables to perform more in-depth analyses across containers, services, or jobs in this cluster, is another helpful tool you discovered.
You may pick the task, select Actions, and pick which logs you want to see if you need to look more closely at the application logs to figure out what’s causing this problem.
Look into two more kinds of logs here in addition to using AWS X-Ray traces. First, you can dig down and find container-level root causes using performance logs, which are structured logs with metric data. Second, you look at the application or container logs that have been gathered. You can track the series of events that resulted in any problems with these logs, which provides you with comprehensive insights into how the program behaves inside the container.
You can utilize application logs in this situation.
This makes the process of troubleshooting your application more efficient. In this instance, the downstream calls to third-party apps that result in timeouts are the problem.
Additionally, this improved feature allows your application to be automatically instrumented using Amazon CloudWatch Application Signals. You are able to keep an eye on the health of the application right now and compare its long-term performance to service-level goals.
You choose the tab for Application Signals.
You can correlate container performance with end-user experience is aided by this connection with Amazon CloudWatch Application Signals, which gives you end-to-end insight.
View related traces, which display all correlated services and their effects, when you choose data points in the graphs. In order to identify the underlying causes, you can also view pertinent logs.
Other considerations
Here are some crucial things to remember:
Availability: All AWS regions, including the China regions, now offer Container Insights with enhanced observability for ECS.
CloudWatch container insights pricing
Pricing: Go to the Amazon CloudWatch Pricing page to learn more about the flat metric pricing for Container Insights with enhanced observability for ECS.
Improve the observability of your container workloads by getting started right now.


