Introduction to Multivariate Exploration in Data Science
Data science analyzes huge, complicated databases to find insights. Multivariate exploration is a key data science technique for discovering patterns, trends, and dependencies. Multivariate exploration helps data scientists forecast, test, and decide by showing how variables interact.
What is Multivariate Exploration?
Multivariate analysis analyzes multivariate datasets. Instead of univariate analysis, multivariate analysis explores dataset variables’ interactions, correlations, and dependencies. Multivariate inquiry seeks to determine how factors affect the outcome or how variables combine to create trends.
In a marketing dataset, age, income, and location may affect client purchase behavior. Organizations can tailor tactics by understanding these interdependencies.
Critical Role of Multivariate Exploration in Data Science Understanding Interdependencies: Data scientists use multivariate exploration to explore complex variable interactions. Health data could show how age, gender, lifestyle, and medical history affect a patient’s illness risk.
Multivariate approaches are needed for predictive modeling, which predicts outcomes based on numerous variables. House prices are predicted by evaluating factors like size, location, amount of bedrooms, and more.
Multivariate analysis reveals patterns and trends univariate analysis cannot. Multivariate approaches can study stock prices, interest rates, and economic indicators in financial markets.
Businesses can make better judgments by understanding variable interactions. Understanding multivariate interactions optimizes strategies and solutions in marketing, finance, healthcare, and other fields.
Multivariate Exploration Methods
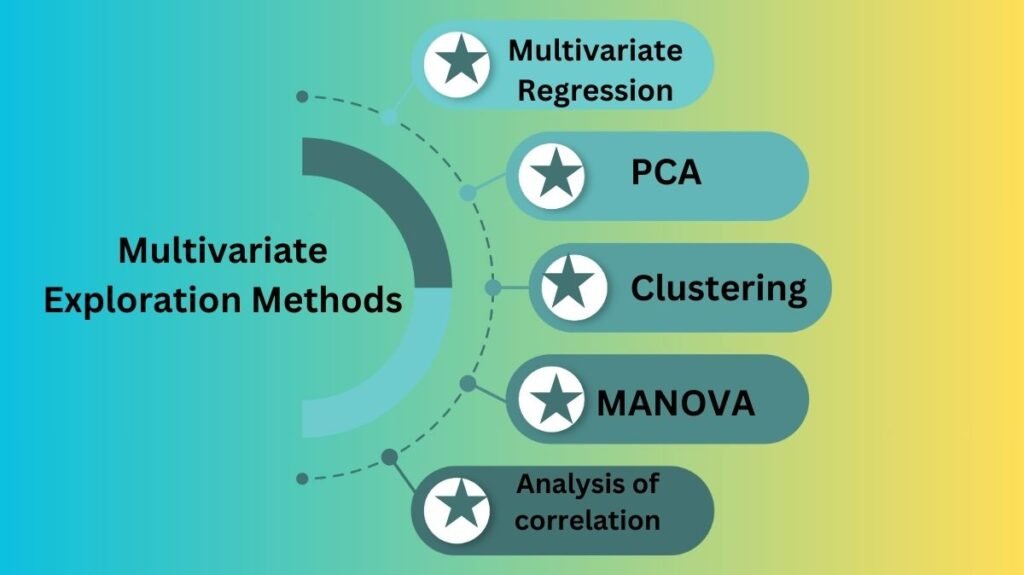
Multivariate exploration uses several strategies to gain data insights. Here are some popular data science methods:

- Multivariate Regression
Multivariate regression examines the link between many independent factors and a dependent variable. In basic linear regression with one independent variable, multiple predictors are included.
A business may seek to predict sales using marketing budget, product pricing, and seasonality. Multivariate regression models one predictor’s effect on the outcome while accounting for others.
- PCA
PCA lowers dataset variables while preserving information. Highly variable datasets are commonly analyzed using PCA.
PCA creates linear “principal components” from the original variables. Large datasets containing correlated variables are frequent in image processing, biology, and finance, where this method is applied.
- Clustering
Cluster analysis groups comparable observations by features. Clustering can organize data in multivariate investigation. K-means clustering, which groups data by feature similarity, is a popular clustering algorithm.
Businesses may utilize cluster analysis to segment clients by demographics, shopping behavior, and internet activity. Understanding these clusters helps firms target diverse client segments with products, services, and marketing.
- MANOVA
MANOVA extends ANOVA to analyze multiple dependent variables concurrently. While ANOVA explores the link between one dependent variable and one or more independent factors, MANOVA can examine how many independent variables affect numerous dependent variables.
MANOVA can be used in healthcare research to examine how different treatment programs (independent variable) affect health outcomes including cholesterol, blood pressure, and weight.
- Analysis of correlation
Correlation analysis measures the strength and direction of a linear link between two or more variables. Multivariate analysis uses correlation matrices to illustrate and quantify variable relationships.
Perfect negative correlation is -1, perfect positive correlation is +1, and no correlation is 0. This method detects collinearity (strong correlation between variables) that may affect model performance and data interpretation.
Multivariate Exploration Tools
Data science has many multivariate analysis tools and libraries. These tools offer statistical analysis and advanced machine learning.
- Python
Python has various multivariate analysis libraries, making it a popular data science language. Important libraries include:
Pandas: A strong data analysis library. Pandas’ DataFrames are appropriate for multivariate data.
Scientific computing library SciPy includes regression and correlation analysis capabilities.
Sckit-learn: A machine learning package with clustering, regression, and dimensionality reduction methods like PCA.
Statsmodels provides classes and functions for statistical models like multivariate regression and MANOVA.
- R
R is another popular data science computer language for statistical analysis. R provides many multivariate analysis libraries, including:
ggplot2: Advanced plots and graphs, including multivariate relationships.
caret: A regression, classification, clustering, and model evaluation package.
FactoMineR does multivariate data analysis, including PCA and clustering.
- Tableau
Tableau lets users create interactive dashboards and multivariate data representations. Data scientists and analysts may quickly analyze complex variable interactions using scatter plots, heat maps, and other interactive visualizations in Tableau.
Multivariate Exploration in Practice
Multivariate exploration is crucial in many domains. Some common real-world uses:
Healthcare: Multivariate methods are used to study how age, gender, genetics, and lifestyle affect illness risk. Multivariate regression can discover cardiovascular-health-affecting lifestyle factors.
Financial analysts use multivariate analysis to study how stock prices, interest rates, and economic data affect market behavior. Multivariate exploration helps portfolio managers weigh investment risk and return.
Multivariate investigation helps marketers understand customer behavior and preferences. Businesses can segment customers and target marketing by researching demographics, purchasing history, and online interactions.
Social Sciences: Social scientists use multivariate methods to explore the relationship between education, income, employment, and crime. Policymakers can create effective interventions by knowing these links.
Multivariate Exploration Challenges
Multivariate inquiry offers insights but also challenges:
When two or more independent variables are significantly connected, regression models might be skewed. To address multicollinearity, use variable selection or dimensionality reduction.
Multivariate analysis requires huge, high-quality datasets. Missing data, outliers, and measurement errors can impair analysis. These challenges require data cleaning and imputation.
Overfitting: Complex models with many variables might overfit and catch noise instead of patterns. Regularization methods like Ridge or Lasso regression can help.
Interpretability: High dimensional multivariate models are hard to interpret. Model interpretation is often improved by visualizations, dimensionality reduction, and feature importance.
Conclusion
Analysts and data scientists need multivariate investigation to understand how various variables affect outcomes. It is essential for predictive modeling, decision making, and finding hidden patterns in complex information. Multivariate exploration offers data driven insights via regression, PCA, cluster, and correlation analysis. Multicollinearity, overfitting, and data quality concerns can be mitigated with right methods and tools, helping firms make better decisions across industries.

