Understanding and Applying Data Science Scatterplots
Data science relies on visualization to understand and analyze data. Scatterplots are essential visual tools. Analyzing the link between two quantitative variables requires a scatterplot. This article discusses scatterplots, their usefulness in data analysis, how to interpret them, and data science best practices.
What is scatterplot?
A scatterplot shows the relationship between two numerical variables in two dimensions. A scatterplot point represents an observation or data point. Each point is located by its values on the independent and dependent variables’ axes.
The x-axis shows the independent variable and the y-axis the dependent variable. Scatterplots help identify data relationships.
Data science relies on scatterplots to find correlations. They visibly indicate linear or non-linear correlation. This visual evaluation helps analysts decide if regression analysis is acceptable.
Finding Outliers: Scatterplots can uncover data points that deviate considerably from others. Outliers can cloud data and model projections, thus they must be identified and managed.
Trend Analysis: Scatterplots assist analysts detect data patterns. Positive correlations (where one variable rises as the other rises) slope upward, while negative correlations slope downward. Trends are key to predictive modeling and forecasting.
Scatterplots are used to test statistical model assumptions. Linear regression assumes independent and dependent variables are linear.This assumption can be verified quickly with a scatterplot.
Importance of Scatterplots
Scatterplot interpretation involves assessing data point distribution and relationship. Interpreting scatterplots requires various considerations:

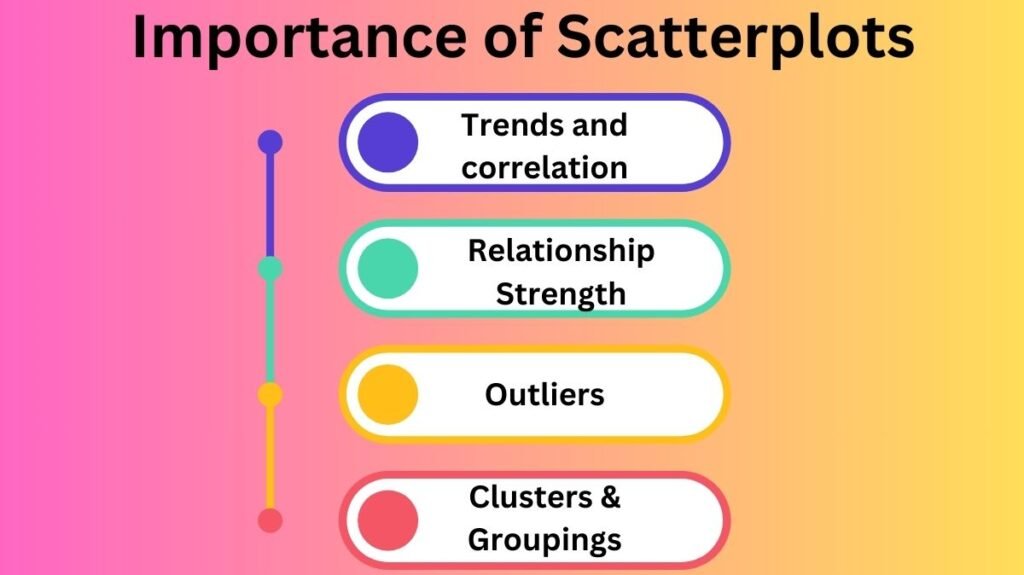
Trends and correlation:Positive correlation occurs when points rise from left to right. One variable rises with the other.
Negative correlation: Points trending left to right are negatively correlated. As one variable rises, another falls.
No correlation: Points spread randomly without a pattern show no correlation between variables.
Relationship Strength: The intensity of the variables’ relationship is indicated by point density and alignment along a straight line or curve. A dense cluster indicates a strong relationship, while a scattered distribution indicates low or no relationship.
Outliers: Outliers are points that deviate from the scatterplot. These points may suggest data gathering faults or rare events or abnormalities that require additional examination.
Clusters & Groupings: Scatterplots can show data groups as clusters of dots. Cluster identification aids segmentation and categorization.
Scatterplot Types
Simple scatterplot: Two variables are shown on the x- and y-axes. This scatterplot analyzes two variables and is the simplest.
Colored Scatterplot: Point color or size might represent a third variable. This gives a more nuanced picture of the data, indicating how another element may affect the relationship.
A three-dimensional scatterplot can be constructed for three variables. Putting the third variable on the z-axis lets you see relationships in three dimensions. While 3D charts offer greater insight, they can be tougher to read than 2D scatterplots.
Bubble Chart: A bubble chart is a scatterplot modification that uses data point size (bubbles) to show a third variable in addition to the x- and y-axes. This lets plots contain more data.
Scatterplot Best Practices
Labeling axes: Label both axes with variable names and units of measurement. It simplifies data interpretation for others.
Scale and Range: Select axis scales. Logarithmic scales can improve visibility if variable values vary substantially. Set the axis ranges to encompass the data spread without leaving big empty regions that could distort the display.
Color and Size: Show categories or variables with colors or point sizes. Be careful not to overwhelm or confuse the audience with these additions.
Gridlines: Gridlines assist readers understand data point values. Gridlines can clutter a visualization, so avoid overusing them.
Overlapping Points: Large datasets may have points with the same coordinates. This can mask varied relationships. Transparency, jittering, or aggregation methods like hexbin displays can help.
Annotations: Outliers and significant data points may benefit from annotations on the scatterplot. This can reveal trends or anomalies for additional research.
Scatterplots in Data Science apply to regression analysis, often in conjunction with regression models. Data scientists can visually evaluate regression line fit using scatterplots. Linear regression points should be roughly straight.
Machine Learning: Scatterplots help examine input feature-target variable connections in machine learning. Understanding these relationships aids predictive model feature selection.
Time Series Analysis: Scatterplots are usually used to study correlations between two variables, but they can also be used to discover patterns, seasonal effects, and anomalies in data across time.
Marketing Research and Segmentation: Scatterplots segment customer data by demographics, purchase behaviors, and loyalty. Visualizing client traits helps organizations target marketing.
Medical Research: Scatterplots are often used in medical research to study correlations between biological or clinical variables, such as smoking and lung disease or medicinal effects on patient recovery.
Conclusion
A significant data science visualization technique, scatterplots reveal variable correlations. Data scientists need them to find connections, anomalies, and patterns in exploratory data analysis. Analysts can make better decisions while building predictive models, doing research, or exploring data by adopting scatterplot best practices. Mastering scatterplots will improve your data analysis and comprehension skills, regardless of your experience.

