The Role of Univariate Exploration in Data Science
Contents
Data Science Univariate Exploration
Univariate exploration begins dataset analysis and comprehension. One variable at a time is summarized to show its properties, distribution, and behavior. Univariate analysis reveals data trends, helps clean data, and informs future research. The importance, methodology, and approaches of univariate exploration in data science are covered in this article.
What is Univariate Exploration
Univariate exploration analyzes one dataset feature or variable. Bivariate and multivariate analysis analyze correlations between several variables, but univariate analysis focuses on each feature’s basic properties.
Univariate exploration summarizes data using descriptive statistics and visualization, making it a crucial data science pipeline stage.
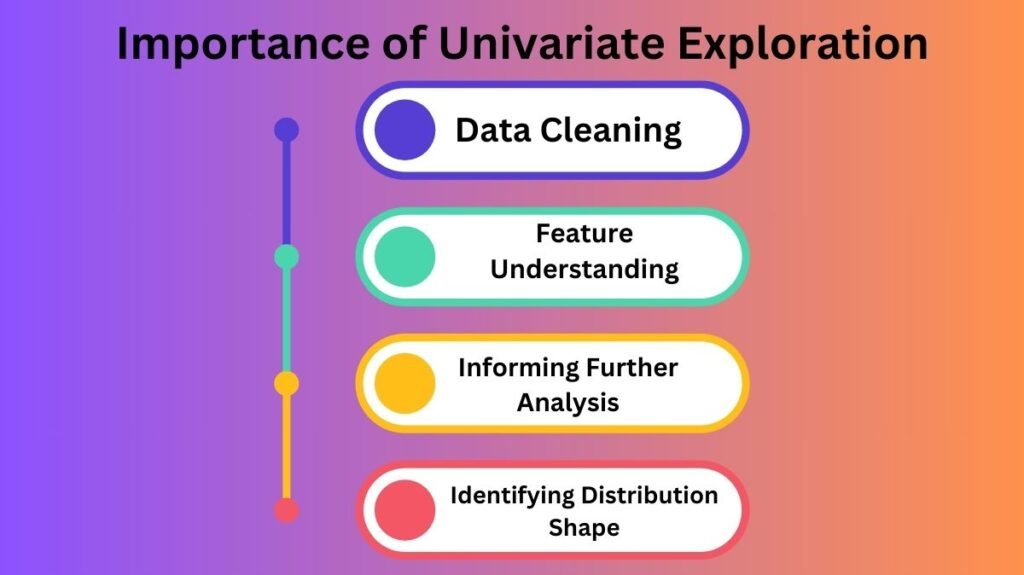
Importance of Univariate Exploration

Data Cleaning: Looking at one variable reveals missing values, errors, and inconsistencies. Finding outliers and unexpected values early improves data preparation and cleaning.
Feature Understanding: Knowing if a feature is categorical or continuous affects analysis, feature engineering, and transformation approaches.
Informing Further Analysis: Knowing each feature’s distribution, variability, and central tendency might help choose advanced statistical or machine learning models.
Identifying Distribution Shape: Knowing whether a variable has a normal, exponential, or other distribution helps choose a model (parametric vs. non-parametric) and decide on transformations like logarithmic or square root adjustments.
Univariate Exploration Methods
Univariate exploration uses descriptive statistics and graphics. Explore these methods.
- Statistics descriptions
A dataset’s central tendency, dispersion, and form are summarized by descriptive statistics. The following are typical univariate exploration calculations:
Central Trend:
- Dataset mean: Average of all values.
- Data median: The sorted middle value.
- Mode: The dataset’s most common value.
Dispersion/Spread:
- Dataset standard deviation: A measure of variation or dispersion.
- Variance: Standard deviation squared.
- Range: Maximum-to-minimum difference.
- Interquartile Range (IQR): The 25th–75th percentiles, which measure spread without extreme values.
Shape of Distribution:
- Skewness: Data distribution imbalance. A positive skew implies a long right tail, while a negative one denotes a long left tail.
- Kurtosis: Distribution “tailedness” Heavy tails or outliers cause high kurtosis.
- Visualization Techniques
Visualization is a powerful data exploration tool. Common charts and graphs for univariate analysis include:
Histograms: Histograms show one variable’s distribution. It breaks data into bins and displays their frequencies. It helps identify outliers and data shapes (normal, bimodal).
Box Plots (Box-and-Whisker Plots):Box-and-whisker plots show range, IQR, median, and outliers. The whiskers cover the lowest and highest values within a specific range (usually 1.5 * IQR), while the box covers the center 50%.
Density Plots:Data distribution is shown via density plots, which are smoothed histograms. It clarifies multimodality and data structure.
Bar Plots:Bar plots show category frequencies for categorical variables. It helps find the most and least common groups.
Violin Plots: Combining box plots with density plots, violin plots illustrate data distribution across categories and highlight multimodal distributions, providing more information than box plots.
- Finding Outliers
Outliers are data points that stand out. They can significantly affect statistical models, especially ones that assume normality (e.g., linear regression). For informed outlier management in univariate analysis, outlier identification is essential.
- Z-scores: Z-scores measure data points’ standard deviations from the mean. Outlier data points have Z-scores more than 3 or less than -3.
- The IQR approach generates acceptable values as 1.5 * IQR below the 25th percentile and above the 75th percentile. Outliers are values outside this range.
- Manage Missing Data
Missing data identification and handling are crucial to univariate research. Many methods can handle missing values:
- Missing values are imputed using the data’s mean, median, or mode.
- Removal: If missing data is too large or not random, it may be eliminated.
- Categorical vs. Continuous Variables
Type of variable affects univariate exploration.
Continuous Variables:Histograms, box plots, and density plots are used to investigate the distribution, find outliers, and comprehend the dispersion of continuous data like age, height, and income.
Categorical Variables:For categorical data like gender, geography, and product category, bar plots, pie charts, and frequency tables are used to show the distribution and find the most and least prevalent categories.
Applications of Univariate Exploration
Univariate exploration is used throughout the data science workflow:
Preprocessing: Univariate exploration is needed to find anomalies, repair errors, and transform features (e.g., normalization, log transformation).
Exploratory data analysis (EDA): univariate exploration helps create data hypotheses. This phase may involve displaying data distribution, validating assumptions, and identifying variables for further study.
Feature Engineering: Univariate analysis informs feature creation. Log transformations can make highly skewed variables more normally distributed, which may be significant for machine learning techniques.
Understanding variable distribution helps data scientists choose algorithms. Linear regression may work for normally distributed variables. Statistically robust algorithms like decision trees may work better if it’s substantially biased.
Conclusion
Univariate exploration is essential to data analysis because it shows dataset aspects in detail. It is essential for data cleaning, model selection, and feature engineering. Data scientists can understand data structure, behavior, and quality using descriptive statistics and visualization. Univariate exploration ensures that data is well-prepared and understood before moving on to more complex models or analysis.
In conclusion, univariate exploration underpins any data science analysis. Univariate exploration helps data scientists get insights and prepare data for advanced analysis by visualizing distributions, checking for outliers, and converting features.